At the beginning of July our COALA community met for the 2nd time. COALA stands for Corporate Learning Analytics. The community was founded in March of this year in order to share experiences in the field of learning analytics. Even though the topic was rated # 1 (!) in Donald Taylor’s L&D Global Sentiment Survey 2020 – it is hard to find any applicable case studies that can be used as a blueprint to boost impact driven training in the industry.
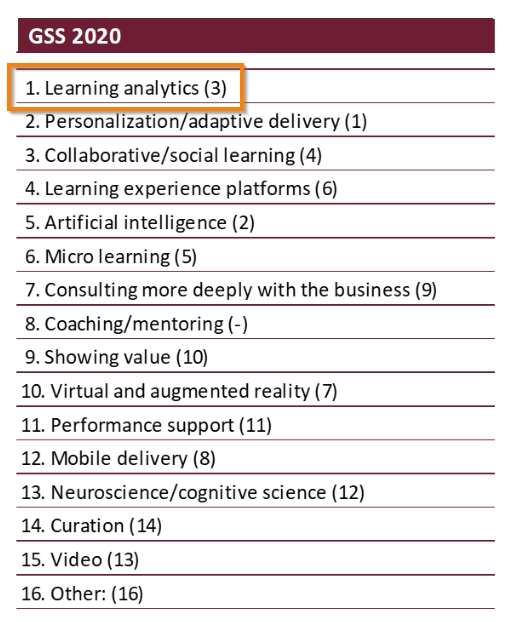
https://donaldhtaylor.co.uk/research_base/the-global-sentiment-survey-2020/
During our last meeting we got inspired by Mathias Groß. Mathias is Professor of Digital Business and Knowledge Management at Leuphana University Lüneburg/Germany and founder of Congenius. He presented two research projects on learning analytics. The first project came from a large food retailer. The target of the project was to create a methodological concept to find out whether web based training (WBT) had a positive impact on sales. The analyzed online courses were about European cheese and whine.
We were impressed by the parameters the project team analyzed, for example interfering influences such as meteorological data, promotional flyers or a European soccer championship that took place during the analyzed period. All these effects obviously had a positive effect on sales, but they were obviously interfering with effects of WBTs. The key question was: Which of the positive sales effects can be traced back to an online training?
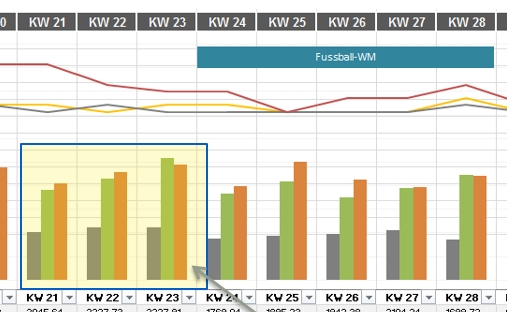
To come to a convincing answer the project team made a deep dive into statistics and analyzed correlations between LMS usage rates and sales.
After Mathias’ presentation, our key takeaway was that it is very important to have good statistical knowledge in order to come to a reliable statement about the impact of e-learning on sales. In food retailing, side effects such as holidays or national events have a stronger effect on sales than e-learning. It is a challenge to find data that is “neutral”, meaning free of interfering influences such as holidays or meteorological events.
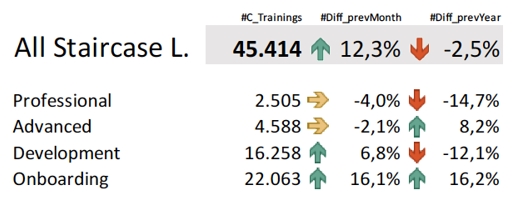
The second project was about creating a learning analytics dashboard for the management of a global producer of luxury goods. After assessing the various needs of regional and local store managers, Mathias Groß and his team came up with a single-page dashboard. It merged both personnel master data and sales figures from SAP. The outcome was an easy to understand dashboard due to its color-coding (red, yellow, green) and arrow scheme.
Our next online COALA meeting will take place on November 12, 2020. We will most likely discuss a case study about how to apply e-commerce knowledge on the analysis of WBTs. The case study will come from a 10,000 people company that manufactures wood-based materials all over Europe.
